

Plant sap analysis represents a significant advancement in agricultural nutrient management
Rapid technological advancements and a shift toward precision farming are reshaping the agricultural landscape. Within this context, plant sap analysis has emerged as a tool that offers real-time insights into the nutritional status of crops.
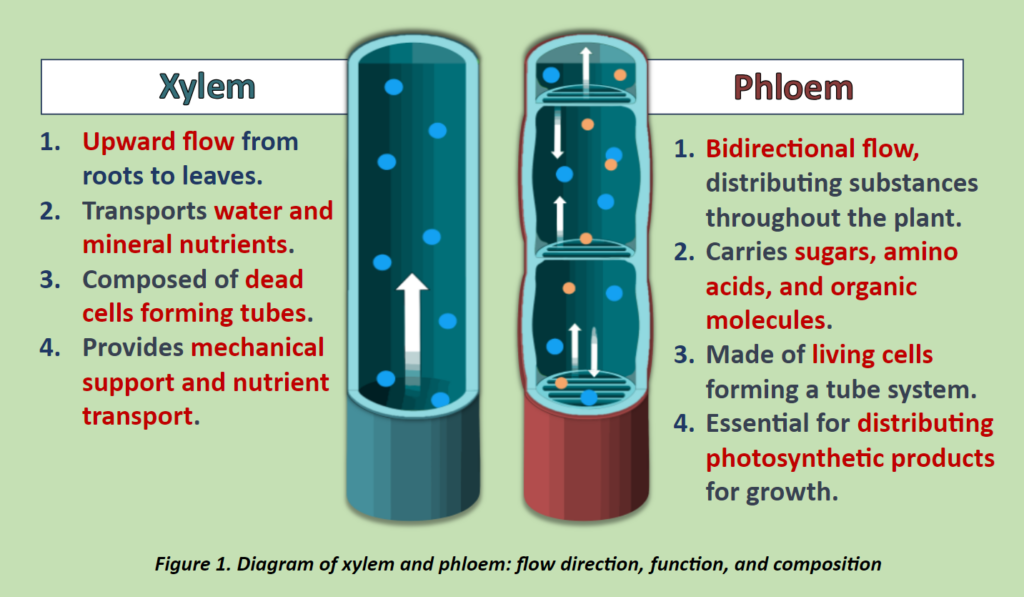
However, comprehending the full potential of plant sap analysis goes beyond just appreciating its technological prowess. It requires an in-depth understanding of plant physiology, especially the roles of xylem and phloem and their functional variations across different plant parts. The xylem, specifically in roots, plays a vital role in absorbing water and nutrients from the soil (Figure 1).
In contrast, the phloem, distributed throughout the plant, is responsible for transporting synthesized nutrients essential for growth, energy and storage. In stems, xylem facilitates water transport and provides structural support, whereas phloem manages nutrient and hormone distribution. In leaves, these systems support photosynthesis and the distribution of sugars (Figure 1 & 2). Recognizing the unidirectional function of xylem and the multidirectional capability of phloem is essential.
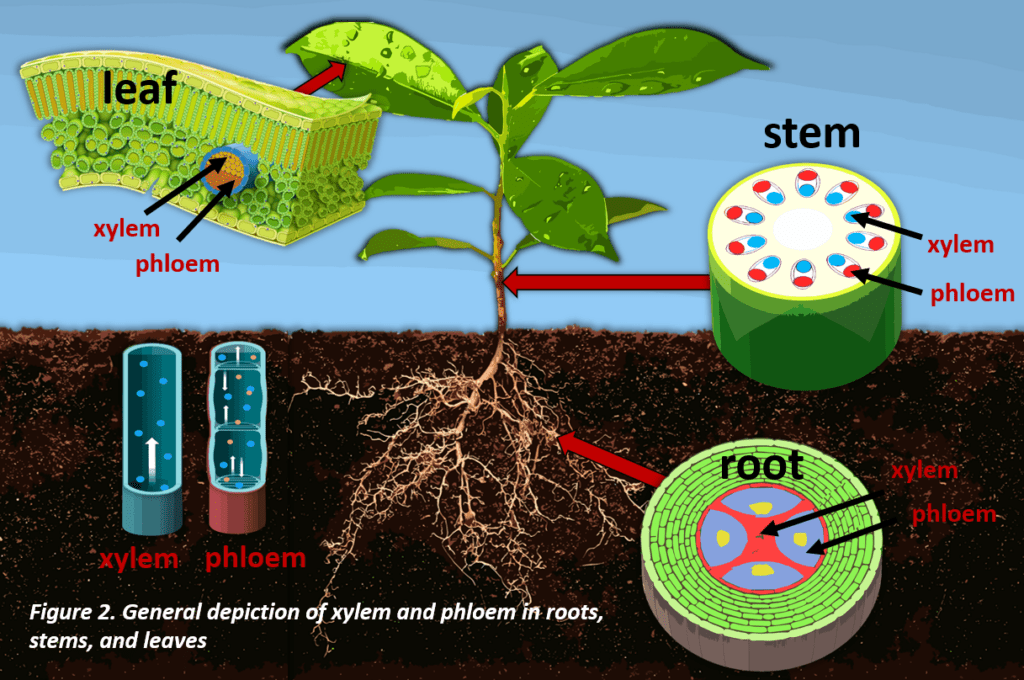
Plant sap analysis represents more than just a technological leap; it is a practical tool for targeted modern farming. The practical application of sap analysis involves extracting sap from plant tissues and analyzing it for nutrient concentrations. This method, being less invasive and more immediate than traditional soil testing, offers timely data for nutrient management and predicting deficiencies prior to their emergence. Unlike whole tissue testing, which gives a cumulative record of nutrient uptake, sap analysis reflects the current nutrient availability and absorption in the plant.
Background and History of Sap Analysis
For centuries, farmers have relied on traditional methods like soil testing, whole-tissue analysis, and visual inspection to gauge the health of their crops. These methods, while useful and standardized, can sometimes provide incomplete information about the plant’s nutritional needs, specifically when diagnosing deficiency symptoms. Whole-tissue testing, for example, involves the drying and grinding of plant samples and looks at the nutrient status of the entire plant component (roots, stems, petioles or leaves), both structural and cellular. Although this has been rigorously studied and standardized for decades, it may not accurately reflect the current metabolic status of the plant.
Sap analysis can offer immediate insights into the plant’s nutritional status — information that is crucial for managing fast-changing nutrient dynamics in crops. It can provide data that is not only immediate but also more representative of the plant’s current nutritional needs. While sap analysis provides a snapshot of the current nutrient status, whole-tissue analysis offers a historical perspective. However, the real value of sap analysis lies in its ability to inform immediate nutrient management decisions — crucial for timely interventions in crop cultivation, especially during nutrient-sensitive stages such as flowering and fruit setting in orchard crops, or the rapid vegetative growth phase in field crops like corn and soybeans, informing management of nutrient-sensitive stages of crop development.
Methods of Sap Analysis
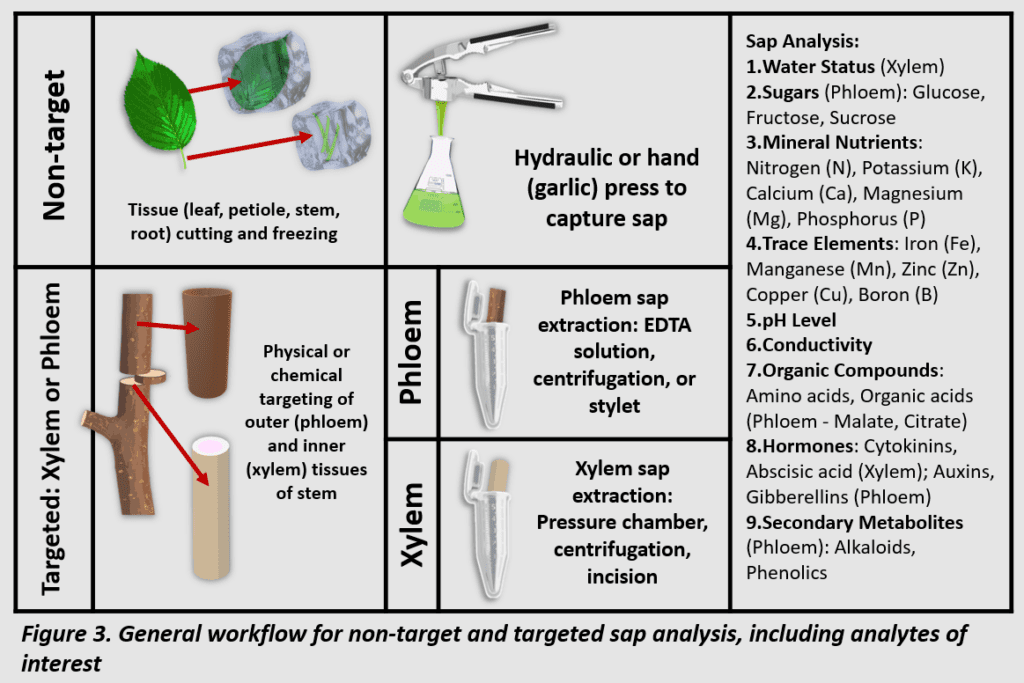
The process of sap analysis involves extracting sap from plant tissues and analyzing it for nutrient concentrations. This method is less invasive, less destructive and, if conducted in the field with testing kits, more immediate compared to traditional soil and plant testing. The method involves selecting appropriate plant tissues, such as roots, stems, petioles or leaves, extracting the sap using specialized equipment, and then analyzing the sap using various chemical analysis techniques (Table 1, Figure 3).
This process, though relatively new, is straightforward enough to be integrated into regular agricultural practices, offering farmers a powerful tool to monitor and manage crop nutrition effectively.
| Sap Type | Method Description | Techniques and Tools | Applications |
|---|---|---|---|
| Xylem | Sampling xylem sap, reflecting water and nutrient transport from roots. | Root pressure exudation, stem incision, pressure chamber technique | Understanding water and nutrient uptake |
| Phloem | Targeting phloem sap, indicative of photosynthate and nutrient distribution. | Aphid stylectomy, EDTA, centrifugation, microcapillary collection | Studying carbohydrate transport and nutrient remobilization |
| Both | Combining aspects of both xylem and phloem sap analysis. | Integrated sampling methods, automated sap flow sensors, hydraulic press | Holistic view of plant nutrition |
| Quick Test | Rapid on-site testing of nutrient levels in plant sap. | Manual or mechanical extractors, test strips, handheld meters | Immediate field-based nutrient management |
Concentrations in Sap Analysis
Sap analysis reveals concentrations of essential nutrients like nitrogen, phosphorus, potassium, calcium and magnesium. These concentrations are indicative of the plant’s immediate nutritional needs and can vary significantly throughout the growing season. For instance, in sweet oranges, concentrations of various nutrients like nitrogen (total N, ammonium and nitrate), phosphorus, potassium, calcium and magnesium were found in specific ranges in mg L⁻¹, varying between cultivars like Valencia and Hamlin.

However, interpreting these concentrations requires an understanding of how they compare to whole-tissue analysis to ensure both crop yield and quality are being supported. The data obtained from sap analysis can be used to make informed decisions about fertilization, irrigation and other crop management practices, ensuring that the crops receive the right nutrients at the right time. Table 2 provides a general, comparative view of nutrient concentrations in different crops, taken from leaves and petioles, highlighting the variations in not only nutrient requirements and uptake patterns, but also whole versus sap nutrient values.
| Crop | Nutrient | Concentration in Sap (ppm) | Concentration in Whole Tissue (ppm) |
|---|---|---|---|
| Corn | Nitrogen | 800 – 1500 | 25,000 – 45,000 |
| Phosphorus | 40 – 80 | 2,500 – 5,000 | |
| Potassium | 1500 – 4000 | 15,000 – 40,000 | |
| Calcium | 500 – 1500 | 5,000 – 20,000 | |
| Magnesium | 150 – 400 | 1,500 – 5,000 | |
| Soybeans | Nitrogen | 700 – 1300 | 35,000 – 55,000 |
| Phosphorus | 30 – 60 | 2,000 – 4,000 | |
| Potassium | 1200 – 3500 | 17,000 – 30,000 | |
| Calcium | 400 – 1000 | 8,000 – 25,000 | |
| Magnesium | 100 – 300 | 2,000 – 8,000 | |
| Wheat | Nitrogen | 600 – 1200 | 20,000 – 35,000 |
| Phosphorus | 30 – 70 | 1,500 – 3,500 | |
| Potassium | 1000 – 3000 | 10,000 – 30,000 | |
| Calcium | 300 – 800 | 3,000 – 15,000 | |
| Magnesium | 100 – 250 | 1,000 – 4,000 | |
| Apples | Nitrogen | 500 – 1000 | 15,000 – 25,000 |
| Phosphorus | 20 – 50 | 1,000 – 3,000 | |
| Potassium | 800 – 2500 | 10,000 – 25,000 | |
| Calcium | 300 – 900 | 5,000 – 18,000 | |
| Magnesium | 80 – 200 | 1,000 – 3,000 | |
| Tomatoes | Nitrogen | 400 – 800 | 30,000 – 40,000 |
| Phosphorus | 30 – 60 | 2,000 – 4,000 | |
| Potassium | 1500 – 3000 | 25,000 – 40,000 | |
| Calcium | 300 – 600 | 6,000 – 12,000 | |
| Magnesium | 100 – 200 | 2,000 – 5,000 | |
| Lettuce | Nitrogen | 500 – 1000 | 25,000 – 35,000 |
| Phosphorus | 40 – 80 | 3,000 – 5,000 | |
| Potassium | 2000 – 3500 | 20,000 – 35,000 | |
| Calcium | 400 – 800 | 10,000 – 15,000 | |
| Magnesium | 150 – 300 | 2,500 – 5,000 | |
| Grapes | Nitrogen | 400 – 800 | 15,000 – 25,000 |
| Phosphorus | 30 – 70 | 1,000 – 3,000 | |
| Potassium | 1000 – 2500 | 15,000 – 30,000 | |
| Calcium | 200 – 500 | 4,000 – 10,000 | |
| Magnesium | 80 – 200 | 2,000 – 4,000 |
Note: These values are approximate, based primarily on non-target (both xylem and phloem) extraction, and should be used as a general guideline.
Application in Major Cash and Specialty Crops
In major cash crops like corn, soybeans and wheat, sap analysis has become an invaluable tool for nutrient management. The challenge, however, lies in adapting this method to different crops, each with unique nutrient requirements and uptake patterns. For instance, in corn, the ability to monitor nitrogen levels in real-time can significantly enhance the efficiency of nitrogen use, reducing waste and environmental impact. In soybeans, sap analysis can guide the management of phosphorus and potassium, which are critical for seed development and overall plant health. The adaptability of sap analysis across various crops underscores its potential as a universal tool in modern agriculture.
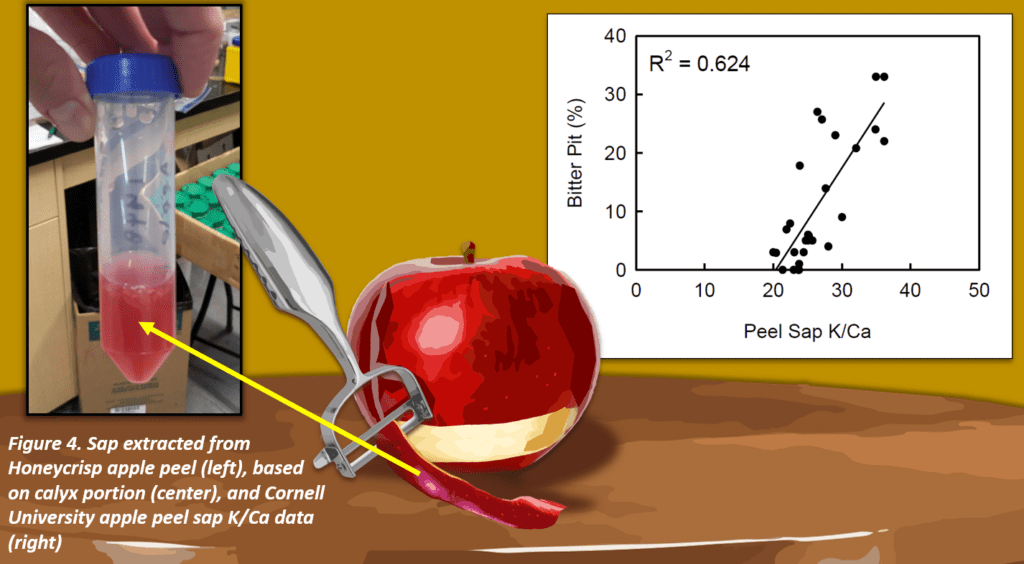
Similarly, in orchard crops like apples, recent advancements in sap analysis have been shown to provide critical information on nutrient dynamics during key growth stages and, ultimately, long-term storage. This is particularly useful given the perennial nature and long growth cycles of these crops. A common challenge, particularly in Honeycrisp apples, is bitter pit, a disorder linked to calcium imbalances. Traditional prediction methods are often slow, providing insights too late for effective intervention. A groundbreaking method developed by Cornell University’s Dr. Lailiang Cheng uses peel sap analysis to predict bitter pit risk in apples with remarkable efficiency. This approach involves taking peel samples from the base or from top to bottom of early-stage apples (Figure 4), where bitter pit commonly manifests, and then freezing and juicing these samples. By analyzing the nutrient levels in this juice, particularly focusing on the key ratios tied to bitter pit prediction, such as K/Ca (potassium to calcium), this method provides essential data about two months before harvest. The correlation between bitter pit occurrence and peel sap K/Ca ratios, which has an R2 value of 0.624 from one study, underscores the predictive power of this technique.
Addressing Deficiencies Indicated from Sap Analysis
Management decisions resulting from sap or other tissue testing are most directly addressed through foliar applications, if possible. In some cases, deficiencies can be related to soil conditions, such as alkalinity, acidity or overall low fertility due to coarse texture soil. As a result, foliar applications are often a more feasible approach compared to modifying soil properties, although soil fertility should still be addressed. In Table 3, a general guide is provided that outlines foliar and soil nutrients, forms, and concentrations to potentially remedy deficiencies indicated through sap analysis.
| Nutrient | Formulation | Concentration & Corrective Measures | Recommended Crops | Foliar Spray Tolerance (kg per 400 L of Water) |
|---|---|---|---|---|
| Nitrogen | Urea, Ammonium, Nitrate | Urea up to 15 lbs/acre; 0.25%–0.5% urea foliar spray | Many crops | Urea: 3-5, NH4NO3, (NH4)2HPO4, (NH4)2SO4: 2-3 |
| Phosphorus | Orthophosphates, Polyphosphates | pH adjustment, phosphorus fertilizers | Tomatoes, other vegetables | H3PO4, others: 1.5-2.5 |
| Potassium | Potassium polyphosphate, sulfate, nitrate | Potassium fertilizers, crop residue incorporation | Soybeans, peaches, watermelons | KNO3, K2SO4, KCl: 3-5 |
| Calcium | Calcium chloride, sugar-based calcium chelates | Liming acid soils, gypsum, 0.75%–1% calcium nitrate foliar spray | Tomatoes, apples | CaCl2, Ca(NO3)2: 3-6 |
| Magnesium | Magnesium sulfate, magnesium nitrate | Dolomitic limestone, 2% magnesium sulfate foliar spray | Tomatoes, oranges, apples | MgSO4, Mg(NO3)2: 3-12 |
| Sulfur | – | Ammonium sulfate, single superphosphate, gypsum | Various crops | – |
| Zinc | Zinc sulfate, chelated zinc | Zinc sulfate soil addition, 0.1%–0.5% zinc sulfate foliar spray | Apple, pear trees | ZnSO4: 1.5-2.5 |
| Iron | Chelated forms | 2% iron sulfate, 0.02%–0.05% iron chelate foliar spray | Plants on high pH soils | FeSO4: 2-12 |
| Copper | CuSO4, Ca(OH)2 mixtures | Copper fertilizer or 0.1%–0.2% copper sulfate foliar spray | Various crops | – |
| Boron | Boric acid, borax, chelated boron | Soil or foliar spray of 0.1%–0.25% borax | Apples, celery | Sodium borate: 0.25-1 |
| Molybdenum | Sodium molybdate, sugar-based chelates | Liming acid soils, soil applied sodium or ammonium molybdate, 0.07%–0.1% foliar spray | Citrus trees, legumes, brassicas | Sodium molybdate: 0.1-0.15 |
| Manganese | Manganese sulfate, chelated manganese | 0.1% manganese sulfate foliar application | Various crops | MnSO4: 2-3 |
Conclusion
Plant sap analysis represents a significant advancement in agricultural nutrient management. As a novel approach to crop management, its ability to provide real-time nutrient data can be invaluable for making informed decisions. As agricultural practices continue to evolve towards real-time precision, sap analysis could play an increasingly important role in enhancing crop production, nutrient use efficiency and environmental stewardship.
The integration of sap analysis into regular agricultural practices marks a new era in crop management, one that is guided by data, precision and sustainability. This innovative approach not only benefits farmers in terms of higher yields and better crop quality but also contributes to the broader goals of sustainable agriculture and food security.
Patrick Freeze is a soil health scientist, research and development manager, and technical specialist at Ward Labs. He earned his Ph.D. in soil chemistry from Washington State University where he studied soil health and heavy metal chemistry as a USDA NIFA Needs Fellow and in Thailand as a U.S. Fulbright Scholar.