Why we care so much about cation exchange capacity
Editor’s note: This is an excerpt from Don Schriefer’s Agriculture in Transition, which is just one of many classic texts on soil health in the Acres U.S.A. library. Schriefer was an educator consultant from DeMotte, Indiana, who developed a “systems” approach for farm management that related tillage to the management of soil aeration, soil water and residue decay.
A farmer should know several things about soil chemistry to help him understand his soil laboratory data. We will start with a study of the different types of soil nutrients and how they react within the soil. These nutrients fall under two categories: positively charged cations and negatively charged anions, and are listed below.
Cations
Ca++ (Calcium)
Mg++ (Magnesium)
K+ (Potassium)
H+ (Hydrogen)
NH4+ (Ammonium)
Trace Elements
Anions
PO4≡ (Orthophosphate)
SO4= (Sulfate)
NO3− (Nitrate)
We also need to understand the term cation exchange capacity. Cation indicates that we are referring to positively charged elements.
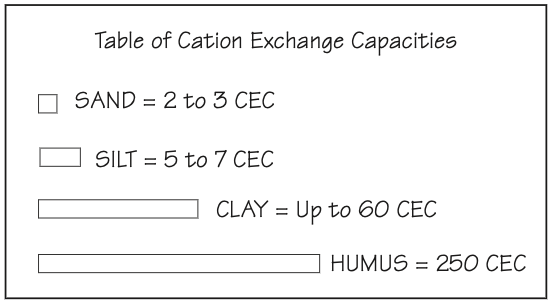
Soil is composed of sand, silt, clay, humus or any combination of these. These all carry various degrees of negative sites, and the number of negative sites determines how many positively charged nutrients (cations) each can hold.
The measurement of the negative sites is given as its CEC (cation exchange capacity). This is often said to be the soil’s “pantry size.”
The soil test lab assigns a CEC number to each soil sample. In effect, this figure is the measurement of how many negative sites are available in 1 acre of soil at a depth of 7-1/2 inches. One acre, 7-1/2 inches in depth, will weigh approximately two million pounds.

The CEC number on your soil tests represents a combination of one or more soil types found in a particular soil area. Sand has a very small “pantry” to hold cations, while the humus pantry is as big as a gymnasium.
A complete soil analysis will also provide a percent base saturation figure for the cations calcium, magnesium, potassium and hydrogen. Trace elements are too small to assign a percent base saturation number.
The percent base saturation figure reports the percent of the negative sites that are filled with each cation. The negative sites need to be filled with a balance of cations. For example, a soil would produce nothing if its pantry were filled to 100% with any one of the cations.
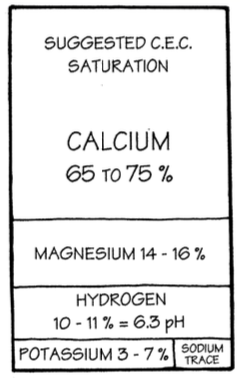
Figure 2 represents what most of us consider a reasonable soil balance. Notice that of the major elements, calcium occupies the vast majority of the pantry, potassium the least. In natural conditions, calcium and magnesium are very important elements and occupy most of the pantry.

Hydrogen is the acid element, and the pH number on your soil test is a measurement of hydrogen activity. When a pantry is filled 10 to 12% with hydrogen, the base soil pH will be approximately 6.3 to 6.5. (Base pH is my way of describing the “off season” pH when there are no acids being produced by roots or activities of soil life.)
If your soil tests show a pH of 7.0 or higher, you will notice the hydrogen percent base saturation is zero. If the percent base saturation of hydrogen is higher, the soil pH will necessarily be lower.
Let us now look at pH. This is necessary because many farmers are still applying limestone based on the pH numbers alone. We must first ask the question, why do we lime? Some would say that its purpose is to adjust the soil pH.
Looking at the chemistry of limestone, we notice it either contains calcium alone (calcitic limestone) or a combination of calcium and magnesium, which is called dolomitic limestone. The calcium and magnesium are coupled to a carbonate (CO3) as CaCO3 and MgCO3.
The carbonates are responsible for raising the soil’s pH and the calcium and magnesium enter the pantry and add to the percent base saturation of these two elements. The carbonates raise the soil pH by combining with and removing hydrogen acid elements.
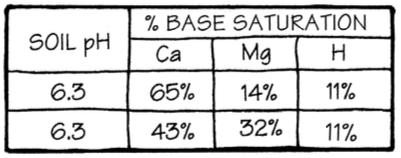
Figure 3 shows just how deceiving a soil’s pH can be. Notice that each soil sample has the same pH. As a result, they all have the same percent base saturation of hydrogen. This is expected because hydrogen, after all, is the acid element.

Look at the differences in pantry-fill of calcium and magnesium. The bottom sample is very low in calcium and extremely high in magnesium. Someone who believes applications of limestone should be based on pH alone might recommend both sample areas be limed to raise the soil pH to 6.5 and 7.0. They would also recommend the highest neutralizing limestone in the area. This would be dolomite limestone that contains both calcium and magnesium. A magnesium limestone raises the soil pH higher than a calcium limestone because magnesium displaces more hydrogen.
Imagine someone recommending a magnesium (dolomitic) limestone for the second sample area, which is already carrying twice the amount of magnesium that it needs and is also very low in calcium. If they do this, they simply must not have a good grasp of nutrient balance.
Another reason we should not apply limestone based on pH alone is that a soil changes from day to day, particularly during the growing season. Figure 4 shows how much a soil pH can change during the season.

Notice how low the pH can go during the peak of the growing season. This is because the root hairs are giving off lots of hydrogen, which lowers the soil’s pH. The soil microorganisms also release several organic acids through their normal activities. These activities result in a temporary lowering of the pH. As the seasonal root and soil life activity declines, the pH returns to its base level.
The question is, how much limestone would be recommended if the soil tests were done in late October, as compared to early July?
We recommend limestone for the purpose of balancing calcium and magnesium in the soil. If a client’s soils need magnesium, a dolomite limestone is used. Regardless of the soil pH number, we have often suggested applications of a calcium limestone because of excessive magnesium in a soil.
It is a grievous error to offer a farmer a soil test that only provides the levels of phosphorous (P), potassium (K) and soil pH. A good thing to remember is that a locally available lime- stone often becomes the wrong one to use on your soils.
I have not attempted to make specific fertility recommendations in this unit. It is too complex without knowing the soil chemistry of a specific farm along with the crop history and exact knowledge of the nitrogen and fertilizer delivery systems used.
| Mitigating midsummer heat stress: some tips from John Kempf – When leaf temperature becomes too warm, plants switch from being photosynthesis dominant to being photorespiration dominant. – The threshold for C3-photosynthetic-pathway plants (most agricultural crops besides corn, sorghum and sugarcane) is a leaf temperature of 78 degrees Fahrenheit. For C4 plants, the threshold is 86 degrees Fahrenheit leaf temperature. – Leaf temperature and air temperature are not the same. The healthier plants become, the better they are at cooling themselves. There are several mechanisms in play. It is clear that plants with a waxy sheen on the leaf surface can have a leaf temperature as much as 8-10 degrees cooler than plants that lack nutritional integrity in the same climactic conditions. – When this threshold is crossed and photorespiration becomes the dominant process, a few important shifts occur: – Photosynthesis / sugar production drops or stops completely – Plants consume their limited available sugar supply – Plants consume any free/available lipids as an energy source (these are abundant in high-energy plants but are very low in plants getting nutrition from soluble ions instead of from living microbes) – Once the supply of available sugars and lipids has been used, plants begin consuming their own proteins as an energy source – Eighty percent of the nitrogen (proteins) contained in plants is in the form of enzymes. Breaking these down further weakens the plant’s ability to recover quickly. Protein catabolism also leads to the formation of ammonium, which is a requirement for spider mite infections. – When plants experience periods of high heat stress, one of the best management strategies is to provide them with surplus energy in the form of sugars, oils and sometimes proteins. Foliar applications of sugars, and sometimes vegetable oils, can produce a tremendous crop response. – During periods of heat stress, growers have reported remarkable crop responses within 24 hours from foliar applications — both when applied proactively (as a preventative) and during and after the heat stress. Including a blend of carbohydrates, enzyme cofactors and humic substances in the foliar mix seems to consistently deliver clear visual results. This was originally published on johnkempf.com. |


