A forty-year soil health experiment…
Like many organic vegetable growers getting started in the ’80s, we judged the health of the soil by its look, smell and feel, and by counting the number of earthworms. We also measured soil quality by the performance of the crops and by using standard soil tests that included soil organic matter analysis and cation base saturation percentages.
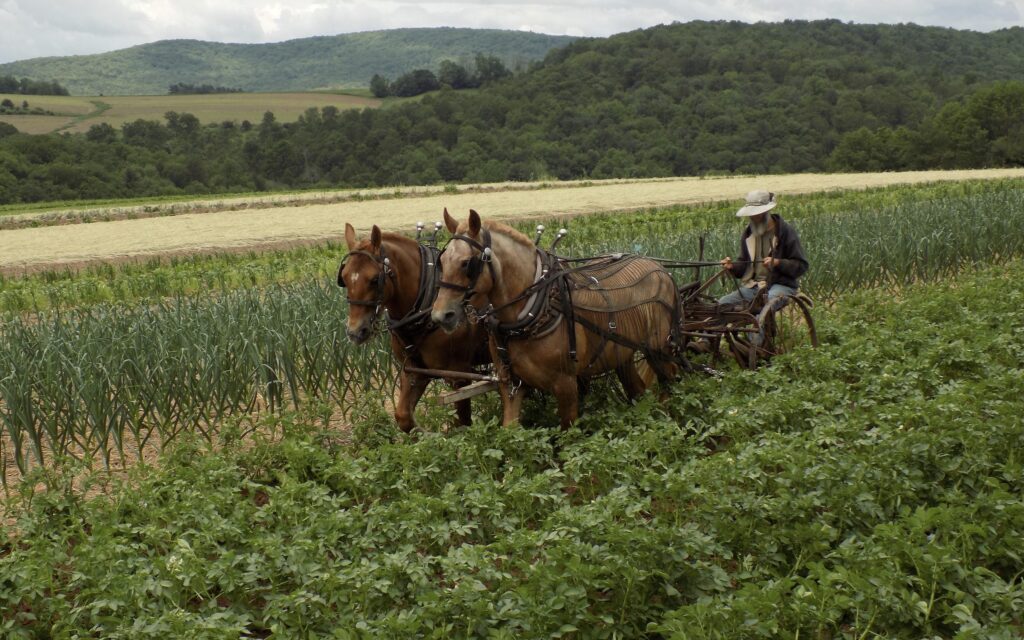
Most importantly, we judged the health of the soil by how well we realized the specific soil management objectives for our farm. Right from the start, we decided we wanted to grow field vegetables without irrigation, reduce weed pressure by using cover crops and bare fallow periods, and rely on the composted manure from our work horses as the only organic-matter input for the market garden.
By these criteria, we have achieved decent soil health on our farm. Taking half of the market garden out of production each year for cover cropping and stale seed bedding has decreased the weed seeds in the soil to the point that we no longer need to hand weed onions and carrots. Low weed pressure has also made it possible to implement conservation practices, like no-tilling and interseeding the vegetables.
Soil crusting was a major problem when we started farming here in 1983, making it difficult to germinate small-seeded vegetables. Within a few years of implementing our fallow-year cover crop system, though, crusting became much less of an issue. At planting time, the soil usually has beautiful tilth, a rich aroma, and large soil crumbs and earthworm casts. In fact, we have trouble maintaining as much surface residue as we would like due to the night crawlers pulling this fresh organic matter down into their burrows.
Shallow tilling the cover crops well ahead of planting the vegetables also reliably preserves enough soil moisture for getting transplanted and direct-seeded crops off to a good start without irrigation. Likewise, planting the produce in widely spaced single rows provides a large reservoir of soil moisture for each plant. Although yield and quality sometimes suffer during extended hot, dry conditions, we have maintained an adequate supply of produce for our farmers market stand and restaurant accounts. Customers rave about the flavor and sweetness of our vegetables.
As for soil testing, the recent report from Waypoint shows that amending the partially composted horse manure with small quantities of rock minerals and finely pulverized lime has kept the cations in good balance for vegetable production. This strategy has also held soil phosphorus close to 50 ppm on a Mehlich-3 extraction. Although at the low end of the optimum range for most vegetables, we think this is a sweet spot for phosphorus because levels above 50 ppm can reduce the quantity and diversity of mycorrhizal fungi in the soil.
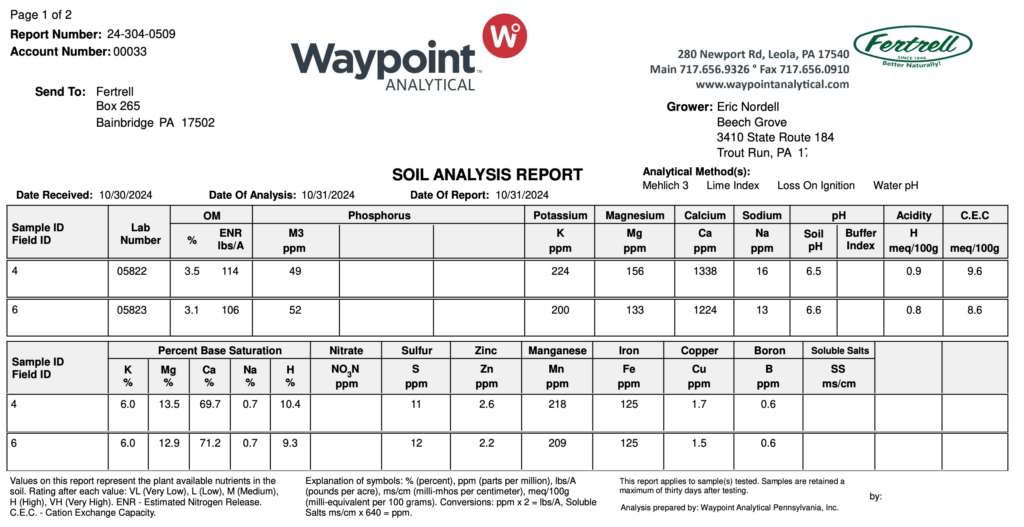
Modest applications of compost and lots of annual cover crops have also kept soil organic matter within a percentage point of our permanent pasture, which seems pretty good for a low-input, tillage-based system. On the other hand, soil organic matter has been stuck in the medium range of 3-4 percent for most of this forty-year experiment, probably due to the repeated use of tillage for proactive weed management and shallowly incorporating the cover crops. The standard soil test also shows that many of the minor elements are deficient.
Of most concern to us is that we still see too much surface compaction from repeated heavy rains. Unless we keep the soil covered with cover crop straw, this consolidation of the top inch or two of the soil slows rainfall infiltration, causing runoff and undermining our goal of capturing every drop of rain. Even more alarming, most of our fields have sunken two or three inches over the years, a phenomenon we have noticed on many vegetable farms. Joining the Pasa Soil Health Benchmark Study in 2018 gave us the likely answer to why our vegetable fields are failing in both areas.
The Pasa Soil Health Benchmark Study
Initiated by Pasa Sustainable Agriculture in 2016 as a pilot project for organic vegetable growers in Pennsylvania, this study now involves organic, conventional and urban vegetable farms, organic and no-till row crop and grain operations, and pastured livestock farms across Pennsylvania, Maine and Maryland. Billed as “one of the largest and most diverse community soil health research projects in the nation,” the Pasa Benchmark Study included 181 farms in 2023.
Participants track fieldwork, soil fertility inputs, and planting/termination dates for three fields and submit soil samples in the late fall to the Cornell Soil Health Lab. Pasa provides each farm with the Cornell Assessment of Soil Health (CASH) for the three fields as well as a customized benchmark report showing how their test results and soil management compare to the other farms in the study.
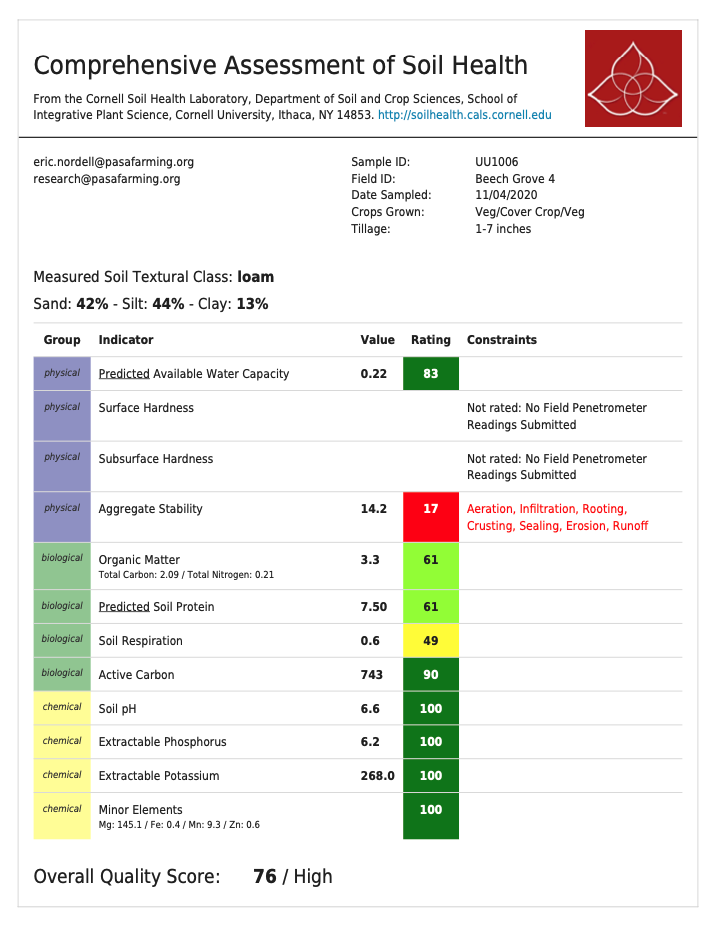
The CASH report gives the lab value for ten different soil health indicators, which are scored on a scale of 0 to 100. These ratings are based on all of the soil samples with the same soil texture in the Cornell database, which includes “many very exceptional soils from across the country.” For example, the 2020 CASH report for our Field 4 showed that our loam soil contained 3.3 percent organic matter. This level of soil organic matter received a score of 61, meaning that for all of the grain, vegetable, dairy farm, beef pasture, orchard and backyard garden samples in the database with a loam soil texture, 38 percent had higher organic matter than our Field 4 and 60 percent had lower levels.
The ratings are also color-coded. Scores from 60 to 80 are shaded light green, indicating a high (excellent) rating. Dark green indicates a very high (optimal) rating, exceeding the 80th percentile. Active carbon in Field 4 received this designation, likely due to the frequent additions of fresh organic matter from the cover crops. According to the CASH report, “active carbon is a measure of the small portion of the organic matter that can serve as an easily available food source for microbes, thus helping maintain a healthy food web…. A healthy and diverse microbial community is essential to maintain disease resistance, nutrient cycling, aggregation, and many other important functions.” Abundant active carbon combined with the ideal nutrient levels in our vegetable fields may explain why we see good crop growth without the need for water-soluble fertilizers.
What stands out most on our CASH report is the embarrassing red rating of our aggregate stability. With a score of just 17, 82 percent of the loam soil samples in the Cornell Soil Health database had better aggregate stability than our Field 4! Code red indicates a very low (constrained) level, which “should be given a high priority in management decisions based on this assessment, as it is likely to be an important constraint to proper soil functioning and sustainability of management at this time.”
Needless to say, we were shocked to find out that this important indicator of soil health was so low in our vegetable fields. We just assumed that the root systems of our fallow-field cover crops formed these water-stable aggregates and that the large soil crumbs we observed when planting the vegetables indicated good soil aggregation. Digging into the CASH manual, we learned that the aggregate stability test measures the percentage of very small aggregates between 0.25 and 2.0 mm in size that survive simulated rain in the lab. These microaggregates were not on our soil health radar.
No doubt, the low level of these small water-stable aggregates was the reason why the top inch or two of our soil solidified from heavy rains, resulting in runoff if the ground was not protected. The slow-but-steady reduction in these micro-aggregates over the years presumably caused a similar decrease in the pore space of the soil, explaining why our fields have gradually sunken a few inches.
According to the CASH report, “Aggregate stability is a measure of how well soil aggregates hold together under rainfall or other rapid wetting stresses…. Good aggregate stability helps prevent crusting, runoff, and erosion, and facilitates aeration, infiltration, soil water storage, improving seed germination, and root and microbial health. Aggregate stability is influenced by microbial activity, as aggregates are largely held together by microbial colonies and exudates, and is impacted by management practices, particularly tillage, cover cropping and fresh organic matter additions.”
Our 2020 Pasa Benchmark Report showed that many vegetable growers also struggle with aggregate stability. Although the majority of Pasa vegetable fields tested significantly higher in this soil health indicator than our farm, the median aggregate stability was only 26 percent, receiving a score of 39. The intensive tillage associated with vegetable production is the likely culprit for this low rating. However, we have talked with a couple of no-till veg growers in the Pasa study who were also disappointed with their aggregate stability results. The participants we happen to know who received high aggregate stability scores rotate their vegetables with livestock grazing either grass or cover crops.
We were already practicing the short-term management suggestions provided in the CASH report for improving aggregate stability: “incorporate fresh organic materials; use shallow-rooted cover/rotation crops; add manure, green manure, mulch.” But we were weak on the long-term management recommendations: “reduce tillage; use a surface mulch; rotate with sod crops and mycorrhizal hosts.” We have tentatively tried to follow these suggestions by minimizing tillage where possible, using the top-growth of the cover crops for mulching more of the vegetables, and replacing, where practical, the annual cover crops in the fallow fields with a one- or two-year sod. We have also tried to improve aggregate stability by using cover crop cocktails containing anywhere from seven to thirteen different species.
Ratings and Peer Comparisons, 2020 Pasa Soil Health Benchmark Report
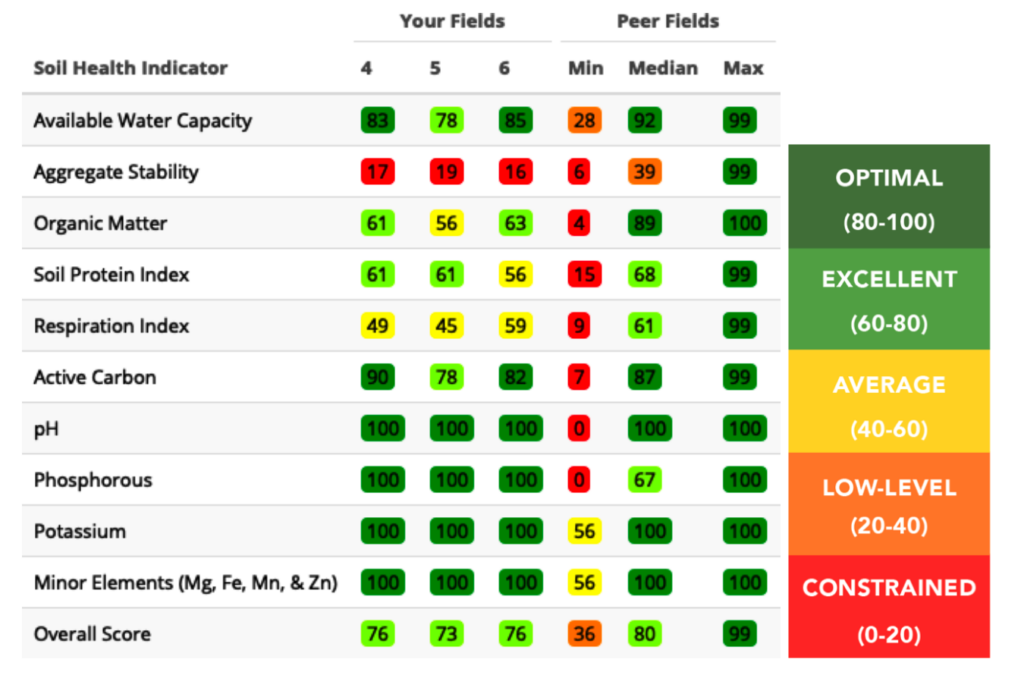
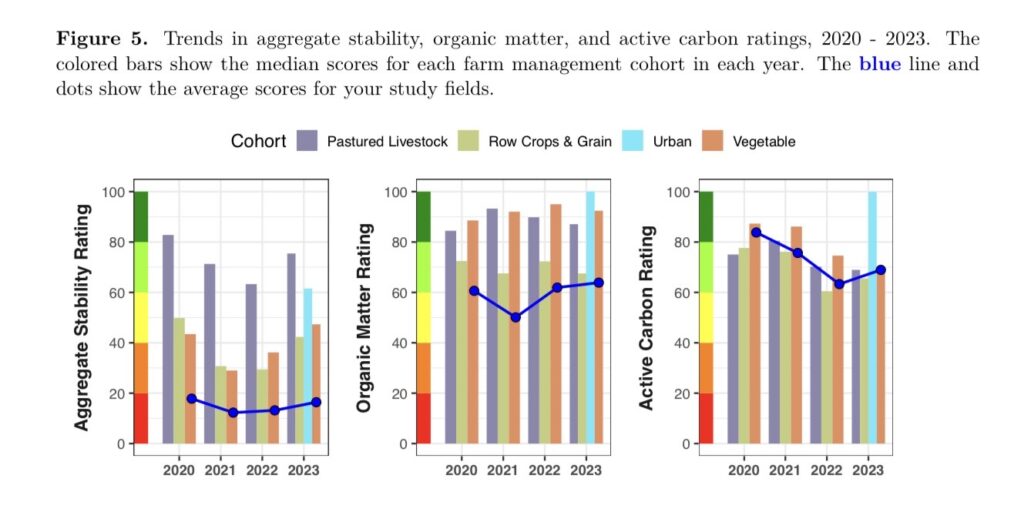
Unfortunately, Figures 5 & 6 from our 2023 Pasa Report show that we have not made much headway with aggregate stability. The average of our three Pasa fields consistently tested much lower in this important aspect of soil health than the median for the veg, grain and livestock farms over the past four years. Yes, our fields accumulated a high number of days of living cover, which should help with aggregate stability, but those numbers may be a little misleading. While densely planted cover crop cocktails and/or sod represented many of the days of living cover we recorded, the days of live cover also included slow-growing vegetables planted in widely spaced rows. Even with a single-row cover crop planted in the vegetable pathways, only a portion of the soil was filled with living roots or covered with live vegetation during the cash crop phase of the rotation.
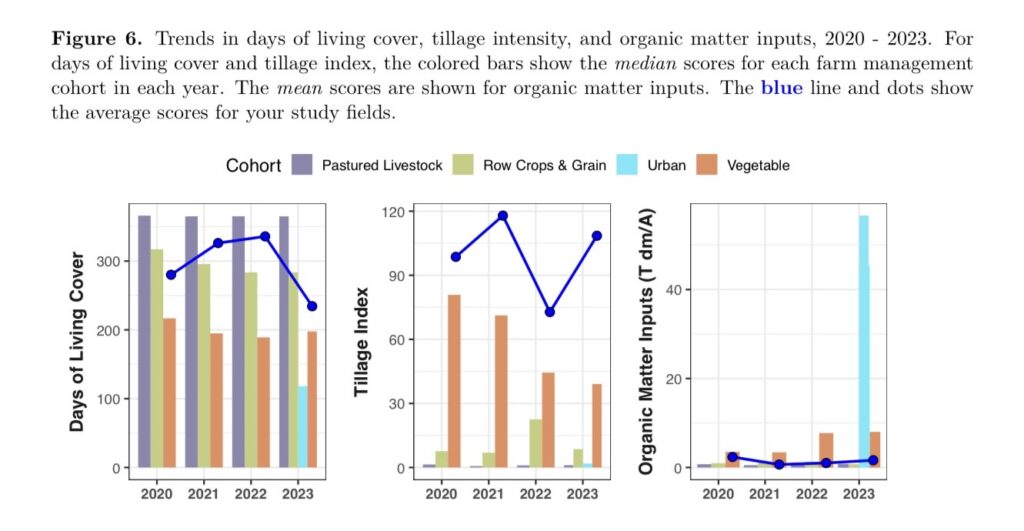
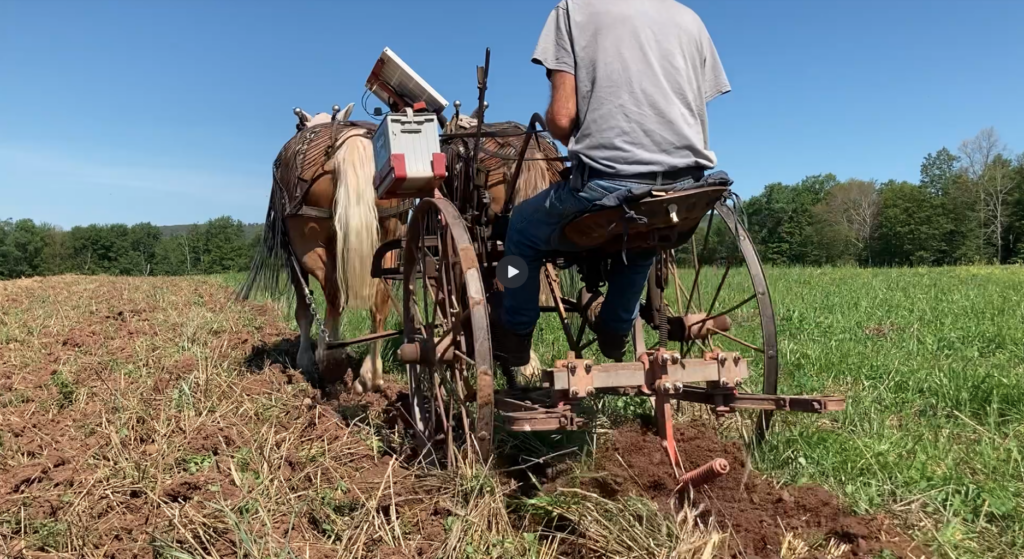
More importantly, our high number of days of living cover was more than offset by a stubbornly high level of tillage intensity. The Pasa tillage index is based on the Soil Tillage Intensity Ratings (STIR) developed by NRCS for different farm implements. Although the STIR ratings for most of our horsedrawn equipment are relatively low, repeated passes over the field add up to a high level of tillage intensity. Ironically, when we replaced the annual cover crops with a full-year grass-legume sod or cover crop cocktail, we needed to make even more passes over the field with our horsedrawn equipment to shallowly incorporate and kill the live vegetation, inflating our tillage index.
To get a better handle on how our soil management practices were influencing the biological and physical soil health indicators, we put together the table “Six Years of Results for Field 4.” We chose Field 4 because it included a typical fallow year sequence of annual cover crops in 2019 and an experimental two-year fallow in 2021-2022, hoping this change would improve aggregate stability.
In 2022, the whole field was well established in a grass-legume sod, maximizing the days of living cover and minimizing tillage intensity. Not surprisingly, Field 4 had the highest soil organic matter that year even though it did not receive compost. We actually exported fresh organic matter by removing several cuttings of grass-clover hay for mulching vegetables in other fields. Perhaps that is why we saw the lowest results for soil protein and active carbon over the six years, and aggregate stability was still pretty abysmal. This indicator actually increased a little in 2023 with the application of compost and plowing down the sod.
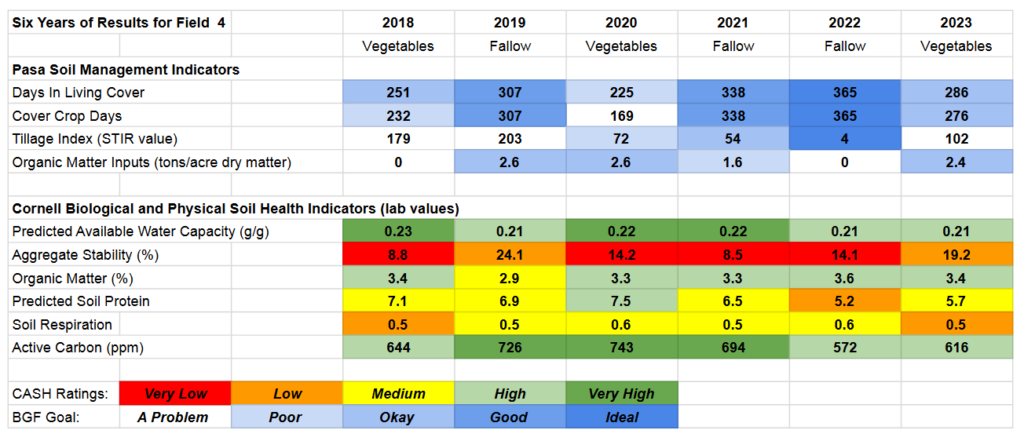
We saw the most improvement in aggregate stability with our usual fallow year management in 2019. This was unexpected considering the super high tillage index due to the shallow incorporation of two annual cover crop mixes plus stale seed-bedding for weed management. Perhaps the fresh additions of organic matter from tilling in the cover crops and compost explained the increase in these water-stable microaggregates. The tradeoff was that 2019 had by far the lowest soil organic matter of the six-year period. Interestingly, we saw the highest soil protein, respiration and active carbon following the incorporation of more compost and crop residues in 2020.
Our takeaway from the table is that improving all of the soil health indicators may require maximizing the days of live cover, minimizing soil disturbance, and increasing fresh organic matter inputs. Following the example of our Pasa peers who rotate vegetables with livestock on pasture would be an obvious way for us to optimize all three variables.
An Internal Soil Health Benchmark
Bob Schindlebeck, the director of the Cornell Soil Health Lab, recommends that farmers send in a soil sample from an undisturbed part of the farm to compare with their intensively managed fields. We acted on this advice in 2021, collecting a sample from our horse pasture the same day as sampling the Pasa fields in our market garden. Although soil from under an adjacent fenceline or some other nearby area that has received zero inputs and disturbance would make a better baseline, the pasture had not been tilled in at least 45 years.
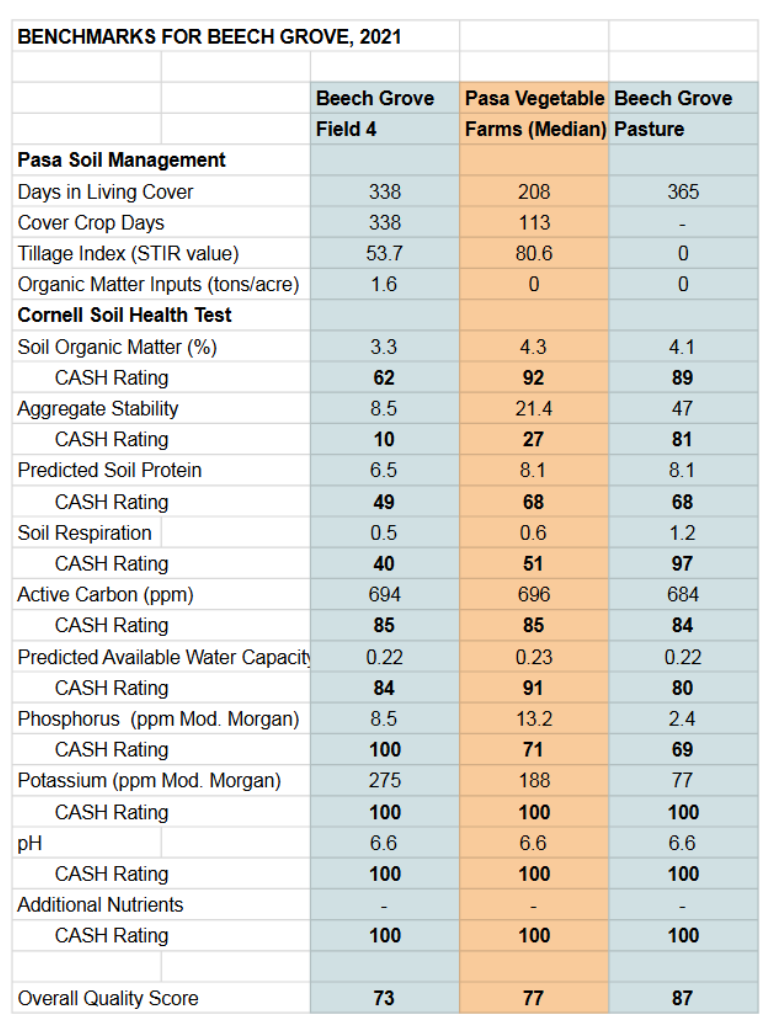
The Benchmarks for Beech Grove table compares the horse pasture with the 2021 CASH results for our Field 4 and the median of the Pasa vegetable fields. The horse pasture set a super high bar for soil respiration, which is a measure of biological activity. The respiration rate of our pasture was 1.2, earning a score of 97. By contrast, Field 4 was only 0.5, with a borderline low rating of 40. Clearly, we should be able to improve this soil health indicator in our vegetable fields, but it might require emulating the permanent pasture to do it.
The horse pasture also received an optimal rating for aggregate stability, suggesting that we should be able to do a lot better with this soil health parameter as well. However, the lab result for this internal benchmark was only 47 percent, which did not seem particularly high, even if was in the same ballpark as the median of the Pasa pastured livestock farms.
Likewise, the soil organic matter of 4.1 percent did not seem all that great for permanent pasture, even if it received a very high score of 89. The median soil organic matter for both the Pasa veg and pastured livestock fields was a little higher than our internal benchmark, meaning that more than half of the veg and pastured livestock fields had a higher rating of soil organic matter than our undisturbed pasture.
I shared these outcomes in an email exchange with Bob Schindlebeck and wondered if they indicated that improving soil organic matter and aggregate stability may be more of a challenge at our location. He responded, “Hi Eric. I think you have it just right! Some soils only get ‘so good.’ This is simply their natural capacity. Some combination of soil particles simply work well together — but this even varies depending on the mineral itself. And of course you can ‘bulk up’ a given soil by adding composts and concentrates, but the soil will move from this back to its equilibrium state…. That is why we like the ‘benchmark’ sample — this way we can see how our ‘intensive management’ is affecting the measurements in a field compared to an ‘undisturbed’ or more natural area.
“The benchmarking example of the aggregate stability has a caveat. The two contrasting samples are ideally taken rather close to each other so that the same base soil material resource is being compared. The only difference would be the way we have managed the soil material. Again, we see some sites with very low aggregate stability at both locations. Could we think of this under-the-fence low aggregate stability evidence of a site that is like the ‘slender’ person eating heartily, but remaining lean?
“Each farm, each field, has strengths and weaknesses which a grower comes to understand with wisdom. When something really works or really fails, we learn the most.”
In retrospect, our original criteria for judging soil health served us pretty well over the years in terms of growing good crops and achieving our goals. On the other hand, getting testy right from the start would have alerted us to the underlying weaknesses in our soil management much earlier, encouraging us to redesign our system to optimize all aspects of soil health.
| Learn more about Pasa Sustainable Agriculture’s citizen science project at https://pasafarming.org/soil-health-benchmark-study. The Comprehensive Assessment of Soil Health Training Manual describes each of the soil health indicators and how they are tested and scored. It also provides guidance on how to use the CASH reports, helpful information for improving soil health, and instructions for collecting and submitting soil samples. https://soilhealthlab.cals.cornell.edu/manual |
As much as Anne and Eric Nordell would like to continue their soil health experiment for another 40 years, they have started the transition to semi-retirement. Their slide presentation video, “Weed the Soil, Not the Crop”, is now available on YouTube.


